Hi,
I want to plot 2 signals: desired velocity and current velocity. Both come from a `Twist`, and I want to plot `/linear/x`. I try with `rqt_plot` and it can successfully plot the desired velocity, but not the current velocity.
Please have a look here:
https://imgur.com/a/bTqXF
However I can see the topic is being correctly published with `rostopic echo`:
$ rostopic echo /current_velocity/twist/linear/x
1.7227491072e-08
---
1.7227491072e-08
---
5.7998790784e-07
---
6.097357376e-07
---
5.9487299872e-07
What's the problem?
Thanks!
↧
rqt_plot not plotting one signal; rostopic echo works
↧
Rosbag live data
Is it possible to plot string values using rqt_plot ?
↧
↧
Using rqt_plot functionality with dictionary element in parameter
I've been trying to use `rqt_plot` functionality that involves dictionary but couldn't get it displayed. Obviously, something is not correct somewhere.
rostopic echo /gazebo/model_states
gives me something like below:
name: ['ground_plane', 'asphalt_plane', 'first_2015_trash_can']
pose:
-
position:
x: 0.0
y: 0.0
z: 0.0
orientation:
x: 0.0
y: 0.0
z: 0.0
w: 1.0
-
position:
x: 0.775434
y: 2.97518
z: 0.0
orientation:
x: 0.0
y: 0.0
z: 0.0
w: 1.0
-
position:
x: 3.82387818665
y: 3.40090985756
z: 0.0500026991437
orientation:
x: 5.04793066057e-05
y: -1.94916170948e-05
z: -0.00420963773061
w: 0.999991137972
What I'm interested in is the x-position of `first_2015_trash_can` i.e. one of the pose information of the third object. I've tried to do
rqt_plot /gazebo/model_states/name:'first_2015_trash_can'/pose/position/x
but didn't succeed. I've also tried:
rqt_plot /gazebo/model_states/name[2]:pose/position/x
but doesn't work either.
Any ideas what could go wrong?
↧
Real time robot position visualization
I have a ros node which simulates an underwater vehicle 2D motion, by reading the yaw reference angle from a topic published by another node and whose value is computed comparing the current vehicle position with respect to a desired one.
I would like to visualize the real time position of the vehicle (meaning while the node encharged to simulate the vehicle computes it) on a graph whose axes are the x and the y of the reference frame.
So far I have used rqt_plot, but it merely allows to visualize the topic contents referred to the time the data is computed.
Any suggestion?
↧
Show matplotlib plot in rqt
I have a plot in matplotlib, which I am using to control the robot. I have `plt.connect('motion_notify_event', self.moveRobot)` function, which controls the robot. Below is the code snippet:
import matplotlib
from matplotlib import cm
import matplotlib.pyplot as plt
fig = plt.figure()
ax = fig.add_subplot(111)
ax.set_xlim((xmin, xmax))
ax.set_ylim((ymin, ymax))
fig.canvas.draw()
fig.tight_layout()
fig.canvas.draw()
plt.connect('button_press_event',self.mouseClick)
plt.connect('motion_notify_event', self.moveRobot)
plt.show()
I want to see this plot inside rqt. Any suggestions, please?
↧
↧
Cannot use rqt_plot to plot ardrone/navdata
I am new to ros. I just starting working with the tum_simulator, ardrone_autonomy and tum_ardrone packages. I am using the simulation in tum_simulator and not an actual drone. I would like to plot ardrone/navdata using rqt_plot. When I tried this I get a blank screen. The command I used was
**$ rosrun rqt_plot rqt_plot /ardrone/navdata**
When I run
**$ rostopic echo /ardrone/navdata**
I get the values. I don't understand why I can't plot the values that I obtain using rostopic echo.
↧
Can't use rqt_plot with some topics
Hi to all,
I'm not able to use `rqt_plot` with some topics (I'm using ROS Indigo).
I this it's because I can't find the correct field name and so I'm not able to correctly specify the path in `rqt_plot`.
This is my [bag file](http://www.skeetty.com/plot.bag) and, for example, it outputs the following data for /robo/io topic:
data: 1511957429.218142138,0,0,0,0,3416,1441,0,0,0,0,0,0,0,0,0,1,1,0,1,1,1,1,0,0,0,0,0,0,0,0,6551
---
data: 1511957429.318112290,0,0,0,0,3442,1169,0,0,0,0,0,0,0,0,0,1,0,0,1,1,1,1,0,0,0,0,0,0,0,0,6552
---
data: 1511957429.418157183,0,0,0,0,3345,1283,0,0,0,0,0,0,0,0,0,1,0,0,1,1,1,1,0,0,0,0,0,0,0,0,6553
---
data: 1511957429.518295379,0,0,0,0,3294,1374,0,0,0,0,0,0,0,0,0,1,1,0,1,1,1,1,0,0,0,0,0,0,0,0,6554
---
data: 1511957429.618295945,0,0,0,0,3294,1306,0,0,0,0,0,0,0,0,0,1,1,0,1,1,1,1,0,0,0,0,0,0,0,0,6555
---
data: 1511957429.718757851,0,0,0,0,3258,1366,0,0,0,0,0,1,1,0,0,1,1,0,1,1,1,1,0,0,0,0,0,0,0,0,6556
---
data: 1511957429.818196624,0,0,0,0,3307,1473,0,0,0,0,0,0,0,0,0,1,1,0,1,1,1,1,0,0,0,0,0,0,0,0,6557
This is the result of `rostopic type`:
rostopic type /robo/io
std_msgs/String
All the topics included in the bag file come out from a ROS node which I wrote.
I'd like to plot columns 6 and 7 of `/robo/io` by using `rtq_plot` or any other tool available under ROS.
Can you help me, please?
↧
rqt_plot error from incomplete joint state data
I am trying to plot joint efforts from a [Baxter](http://www.rethinkrobotics.com/baxter/) robot in rqt_plot. I can subscribe to robot/joint_states and get the data just fine. The format for the effort portion of the data is like this (from a rostopic echo):
effort: [0.0, 0.0, -1.66, 0.0, -0.872, -4.472, -0.084, -0.168, -0.008, -0.2, -19.056, 0.216, -26.844, -0.288, 0.076, 0.056, -20.48]
However, when I try to plot individual components of this effort in rqt_plot, effort[0] is the only one that works. If I add effort[1] or higher, I get the following error:
PlotWidget.update_plot(): error in rosplot: [/robot/joint_states/effort[1]] index error for: header: , seq: 122200, stamp: , secs: 1517944540, nsecs: 889999872, frame_id: '', name: [r_gripper_l_finger_joint], position: [0.0], velocity: [0.0], effort: [0.0]
My best theory for the cause is that sometimes the effort field has just one component, which seems to be what the error message above is complaining about. I don't know why this occurs, but is it possible to make rqt_plot ignore the occasional missing data and just display what shows up? Alternatively, is there a built in way to prune out this missing data before I pass it along?
I am running the latest versions of rqt_plot, Ros Kinetic, Ubuntu 16,
↧
rqt_plot stops plots only zeros
rqt_plot was working fine, but now only plots zeros no matter what values I sent to it.
And yes, I've zoomed in and the values really are zero, even though I'm sending a sawtooth plot between 5 and -5.
I've tried uninstalling and installing but the same problem. I notice it retains it's plot configuration (i.e. the message it's plotting) thru the uninstalling and installing process, so there is a config file somewhere. I'd like to delete this file and see if plotting function returns.
Any ideas?
↧
↧
rqt_plot plot 2d data
Hi everyone.
I have a topic which publishes arrays of data. Is there a way to use rqt_plot to plot the arrays in real time?
This is not like visualizing a topic which publishes numbers and plot value vs time. What I need is just plotting the data (a plottable array of floats) anytime a message is published, and plot value vs index over and over.
Thanks
↧
rqt_plot causing crash to rqt
I am trying to run rqt_plot with ros2 crystal release , its causing crash to the rqt and showing below error:
QMetaType::registerType: Binary compatibility break -- Size mismatch for type 'QUuid' [30]. Previously registered size 16, now registering size 0.
↧
fedora: rqt_plot runtime error
I'm running ROS Kinetic on Fedora 29.
After running successfully these commands:
rosrun turtlesim turtlesim_node
rosrun turtlesim turtle_teleop_key
rqt_graph
I try to run `rqt_plot /turtle1/pose/x /turtle1/pose/y` or equivalently `rqt_plot /turtle1/pose/x:y` and it gives the following error:
Warning: QT_DEVICE_PIXEL_RATIO is deprecated. Instead use:
QT_AUTO_SCREEN_SCALE_FACTOR to enable platform plugin controlled per-screen factors.
QT_SCREEN_SCALE_FACTORS to set per-screen factors.
QT_SCALE_FACTOR to set the application global scale factor.
PluginManager._load_plugin() could not load plugin "rqt_plot/Plot":
Traceback (most recent call last):
File "/home/Giuseppe/ros_catkin_ws/install_isolated/lib/python2.7/site-packages/qt_gui/plugin_handler.py", line 99, in load
self._load()
File "/home/Giuseppe/ros_catkin_ws/install_isolated/lib/python2.7/site-packages/qt_gui/plugin_handler_direct.py", line 54, in _load
self._plugin = self._plugin_provider.load(self._instance_id.plugin_id, self._context)
File "/home/Giuseppe/ros_catkin_ws/install_isolated/lib/python2.7/site-packages/qt_gui/composite_plugin_provider.py", line 71, in load
instance = plugin_provider.load(plugin_id, plugin_context)
File "/home/Giuseppe/ros_catkin_ws/install_isolated/lib/python2.7/site-packages/qt_gui/composite_plugin_provider.py", line 71, in load
instance = plugin_provider.load(plugin_id, plugin_context)
File "/home/Giuseppe/ros_catkin_ws/install_isolated/lib/python2.7/site-packages/rqt_gui_py/ros_py_plugin_provider.py", line 60, in load
return super(RosPyPluginProvider, self).load(plugin_id, plugin_context)
File "/home/Giuseppe/ros_catkin_ws/install_isolated/lib/python2.7/site-packages/qt_gui/composite_plugin_provider.py", line 71, in load
instance = plugin_provider.load(plugin_id, plugin_context)
File "/home/Giuseppe/ros_catkin_ws/install_isolated/lib/python2.7/site-packages/rqt_gui/ros_plugin_provider.py", line 101, in load
return class_ref(plugin_context)
File "/home/Giuseppe/ros_catkin_ws/install_isolated/lib/python2.7/site-packages/rqt_plot/plot.py", line 55, in __init__
self._data_plot = DataPlot(self._widget)
File "/home/Giuseppe/ros_catkin_ws/install_isolated/lib/python2.7/site-packages/rqt_plot/data_plot/__init__.py", line 149, in __init__
raise RuntimeError('No usable plot type found. Install at least one of: PyQtGraph, MatPlotLib (at least %s) or Python-Qwt5.' % version_info)
RuntimeError: No usable plot type found. Install at least one of: PyQtGraph, MatPlotLib (at least 1.4.0) or Python-Qwt5.
So I've checked these three libraries and it seems they're all installed:
-for PyQtGraph I have `python3-pyqtgraph`
-for MatPlotLib I have `python2-matplotlib`
-for Python-Qwt5 I have ` PyQwt-5.2.0-40.fc29.src.rpm`
So I don't get why this is not working properly since I have all of them.
Anyway, I think that instead of `python3-pyqtgraph` I should install `python2-pyqtgraph` but `dnf` doesn't find it because it's an old version I think (or maybe it is deprecated).
↧
Visualize or plot Float32MultiArray data field
Similar to this [question](https://answers.ros.org/question/175151/rqt_plot-plot-2d-data/), is there a way to plot the data field of a `Float32MultiArray` message type? I'm trying to show the FFT of a signal in real-time and I can't seem to find a straightforward method of implementing the visualization I've tried Plot juggler, rqt_plot amd rqt_multiplot and they don't seem to have the functionality
↧
↧
ros2 crystal rqt_plot error: find() takes no keyword arguments
I'm using rqt_plot and having trouble. I noticed that there are a lot of these error messages generated when I'm trying to add a field to the plot:
$ ros2 run rqt_plot rqt_plot
Traceback (most recent call last):
File "/opt/ros/crystal/lib/python3.6/site-packages/rqt_plot/plot_widget.py", line 256, in on_topic_edit_textChanged
plottable, message = is_plottable(self._node, topic_name)
File "/opt/ros/crystal/lib/python3.6/site-packages/rqt_plot/plot_widget.py", line 151, in is_plottable
fields, message = get_plot_fields(node, topic_name)
File "/opt/ros/crystal/lib/python3.6/site-packages/rqt_plot/plot_widget.py", line 135, in get_plot_fields
slot_type, is_array, array_size = _parse_type(slot_type)
File "/opt/ros/crystal/lib/python3.6/site-packages/rqt_plot/plot_widget.py", line 57, in _parse_type
end_array_idx = topic_type_str.find(']', start=array_idx + 1)
TypeError: find() takes no keyword arguments
It seems that plot_widget.py expects `topic_type_str` to be of type `string`, but it's of type `str` instead. Am I missing some dependency? Thanks.
↧
rqt_plot not plotting imu_message
Hi everyone,
I am trying to plot imu_data via rqt plot. But rqt_plot does not plot any imu_data. But it is plotting random_number that I am publishing. I can see the data coming from the imu. Also can be verified by rostopic hz below:
rostopic hz /imu_data
subscribed to [/imu_data]
average rate: 34.861
min: 0.028s max: 0.029s std dev: 0.00047s window: 33
average rate: 34.806
min: 0.028s max: 0.033s std dev: 0.00070s window: 68
^Caverage rate: 34.814
min: 0.028s max: 0.033s std dev: 0.00066s window: 88
The command that I am using to plot the acceleration data is
rqt_plot /imu_data/linear_acceleration/x
Can anyone suggest what i am doing wrong?
↧
rqt_graph not showing all active nodes
I've been following through the simple examples for actions and I'm not sure how to change the setting to get rqt_graph to show nodes a level "deeper".
The action is questions is an exact copy of the ones used in: [link](https://wiki.ros.org/actionlib_tutorials/Tutorials/RunningServerAndClient)
The action node graph they get is: 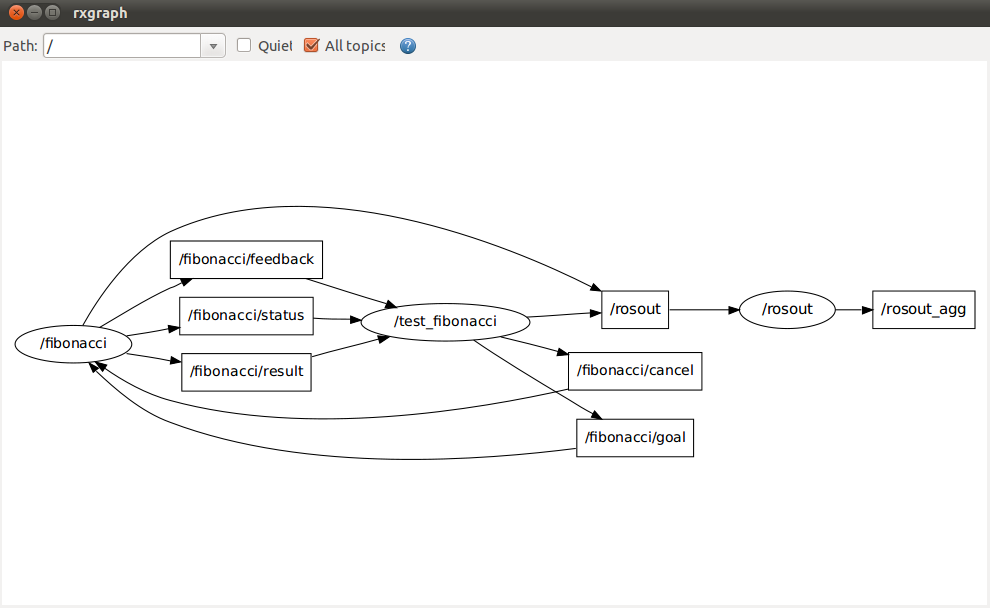
The graph I get instead is: 
and calling `rostopic list -v` returns:
`morten@mortenThinkPad:~$ rostopic list`
`/fibonacci/cancel
/fibonacci/feedback
/fibonacci/goal
/fibonacci/result
/fibonacci/status
/rosout
/rosout_agg`
I'm relatively new to ROS so I'm not quite sure what other information could be relevant. I'm running ubuntu 16.04LTS with ROS kinetic.
edit: adding picture now that I have enough karma
↧
Embed rqt GUI inside our self defined GUI
Purpose : To show the "odom" states curves of each robot model in our self defined GUI(with ros, Qt5 and c++).
Idea: If the panel which shows the states curves of each robot model is written from beginning, it will be a pointless repetition task. Known that the rqt_plot plugin can show the states curves of some topic(e.g. /odom). then my question is that is there any way that I can embed the rqt plugin(written with python) into our self defined GUI(written with c++) ?
Thanks.
↧
↧


